By Rob Coe
An assessment's 'ceiling effect' may have immediate implications for a classroom teacher, but it's also a concern of educational researchers. In this blog, Evidence Based Education's Prof Rob Coe explores the concept through the lens of a real research project using schools' internal assessments. Such educational research carried out by EBE, our partners, and other researchers shapes professional learning—and ultimately can lead to improved pupil attainment and equity.
Imagine you're taking a test. Question after question feels easy, and before long you're scoring near the maximum. Great news for you, but bad news for anyone trying to measure how much you really know.
That problem has a name: the ceiling effect. It happens when a test is too easy for many of the people taking it. Instead of scores spreading out nicely across the scale, they bunch up at the top, pressing against the ceiling of the test.
So what are ceiling effects? Why do they crop up so often in school assessments, and why do should we care?
Ceiling effects in educational research
As an educational researcher, ceiling effects play a role in the work I do. They matter for projects like TIDE (Teaching Improvement through Data and Evaluation)—a five-year research collaboration led by the National Institute of Teaching, UCL, and Evidence Based Education, funded by the Nuffield Foundation. In this project we are using schools' internal assessments to estimate the learning gains of individual classes and investigate the relationship between them and their teacher's experience, specialisms and training routes, as well as school culture. The assessments we are collecting are commercial standardised tests and school- (or MAT-) made assessments, in a range of subjects. Obviously, we need to be sure that the assessments are good enough to support these kinds of uses, so we have developed a range of checks that include looking for ceiling effects.
Considering how common they are, ceiling effects are surprisingly hard to define: there is no simple test for identifying them. A standard approach is just to look at the distribution of scores. Here is an example from one of the assessments in our TIDE dataset, a commercial assessment of reading, taken in autumn by 1,254 Year 6 pupils in 23 schools: 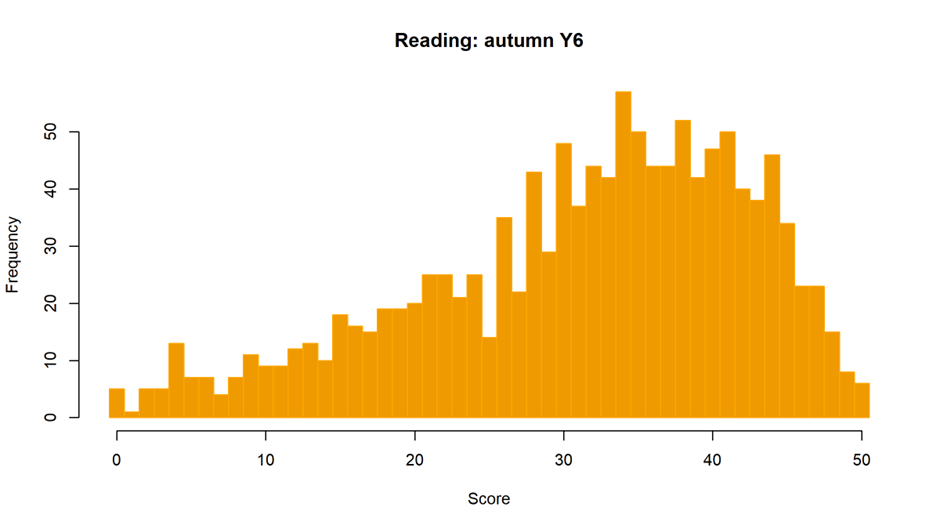
We can see the scores are skewed (the bulge is towards the right of the distribution), but is it really a ceiling effect? Only 6 pupils achieved the maximum score (less than 0.5%), so it doesn't look as though they are bashing up against the ceiling. I think many people would characterise it as a 'slight' ceiling effect. Another way to identify a ceiling effect is with a measure of skewness. This is a statistic that captures the degree of asymmetry. Here, the value is -0.9. Again, most experts would probably interpret this as slightly skewed.
Simulating ceiling effects
I thought I would try to simulate some test scores with a similar distribution. How much would I have to distort a good test generation process to get the same amount of skew? This is the simulation I came up with:
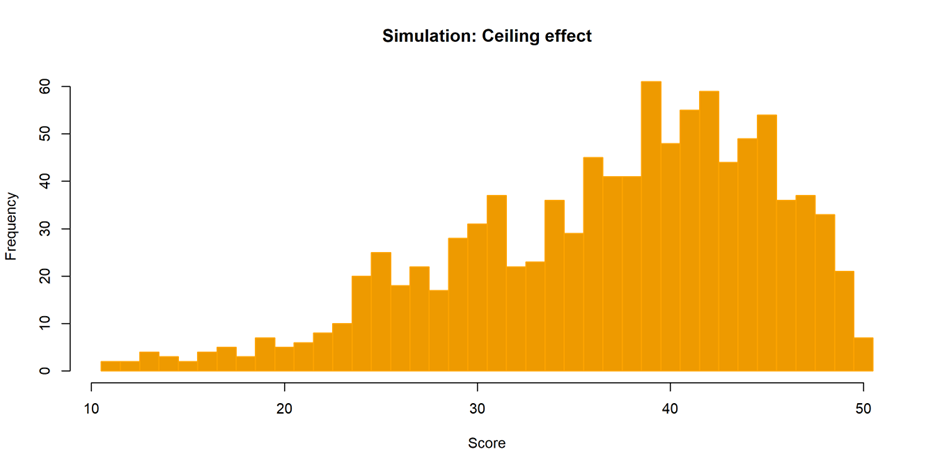
To the eye it looks similar, and the skewness statistic is the same. To (intentionally) create this level of skewness, I had to create a test where all 50 questions are targeted at the bottom half of the ability distribution. In this case, for pupils in the top quarter of the distribution, all the questions are quite easy. Their chances of getting each one correct are high (78-100%); although the probability of getting all 50 questions correct (and hence hitting the 'ceiling') remains low.
Of course, we would all rather take a test where we get lots of questions right! And assessment designers try to make assessments accessible to all. This is probably the main reason why some commercial assessments (including the one I looked at), and even national assessments like SATs and GCSEs, often have these kinds of skewed distributions.
Considering the 'true' scores
But if we imagine the true distribution of the abilities of these same pupils—that is, the distribution we would expect to see if the test had a wider range of question difficulties—it would probably not have this skew. In fact, we would generally expect a symmetric, 'normal' distribution or 'bell curve'. This suggests that the scores of the higher performing pupils have been squashed together by a compression of the top end of the scale.
We can run further statistical tests on these simulated scores in order to estimate 'true' scores.[1] If this simulated assessment had a greater number of challenging items, what might the pupils' scores end up looking like? We get something like this:
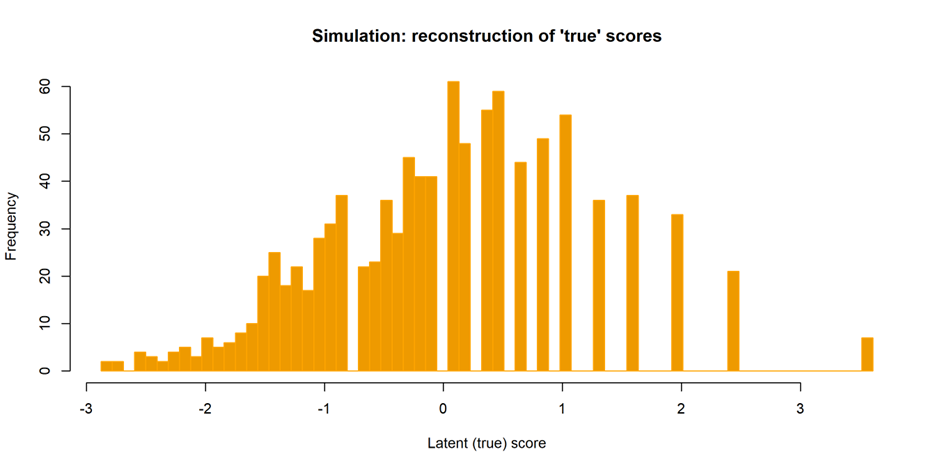
This does look a bit more symmetrical, although we get that only by creating gaps at the top end in the simulated test scores. With a better test, we would have had more information about the higher attainers that would have allowed us to fill those gaps.
Implications of ceiling effects
Does any of this matter?
The good (and perhaps surprising) news is that these kinds of ceiling effects make only a small difference to the reliability of the test and to its correlations with other measures. For classroom teachers using curriculum-aligned assessments, they can still comfortably use these assessments to draw conclusions about student learning and to inform their teaching.
However, the bad news is that school leaders or researchers who want to use these tests to estimate both the progress made by pupils and the impact of teaching—as we do in the TIDE project—it turns out this compression of the scale creates some more serious challenges.
Say there were a high-achieving student who scored 45/50 when they took the test in autumn; when they took the end-of-year assessment they scored 48/50. Did they improve just a little? Or was the improvement greater and unmeasurable on account of the ceiling effect?
If there are not enough harder questions, the same change in underlying learning (as estimated by the latent 'true' score) produces a smaller increase in marks (as observed in the raw score out of 50). If we see only the raw marks, higher attaining pupils will look as though they have made less progress than they actually have. Teachers of higher attaining classes will get lower value-added estimates than they should.
In fact, in one of our analyses, we compared the highest and lowest-attaining Year 6 classes. If both groups made the same real learning gains, the higher group's progress would only appear to be 64% of the lower group's progress on the raw scores on account of the ceiling effect. That's a huge distortion, and potentially very unfair to their teacher!
Expanding the existing research
Surprisingly, many reviews of teacher value-added methods haven't paid much attention to the issue around the ceiling effect (Ballou, 2009). A recent study (Gilbert, Soland & Domingue, 2025) highlights how sensitive teacher effectiveness measures can be to test design choices. But with the TIDE project, we aim to dig deeper into how ceiling effects shape value-added estimates—and what fairer alternatives might look like.
Find out more how the Great Teaching Toolkit gives teachers a personalised professional-learning pathway aligned to evidence-informed teaching here.
[1] I applied an Item Response Theory analysis to the simulated scores to reconstruct a theoretical 'latent' scale, producing the result shown.
References
Ballou, D. (2009). Test Scaling and Value-Added Measurement. Education Finance and Policy, 4(4), 351–383. https://doi.org/10.1162/edfp.2009.4.4.351
Gilbert, J. B., Soland, J. G., and Domingue, B. W. (2025). The Sensitivity of Value-Added Estimates to Test Scoring Decisions. (EdWorkingPaper: 25-1226). Retrieved from Annenberg Institute at Brown University: https://doi.org/10.26300/g4gn-s810
What next?
What next?
Your next steps in becoming a Great Teaching school
