Introducing changes and improvements to the way you access your student survey feedback in the Great Teaching Toolkit!
Since the Great Teaching Toolkit was released last September, its aim has been to provide teachers with high-quality feedback, training and tools in the areas that underpin great teaching in the classroom. Ultimately, it seeks to guide evidence-based, sustained and sustainable professional development in schools and colleges. More than 14,000 licences have been taken up since then in schools and colleges around the world.
Our team of GTT Advisors have been listening to feedback from teachers and leaders in their regular conversations. In this series of blog posts, we’ll explore what feedback we’ve received, what developments and additions we have made, and how they can help you and your colleagues.
You said…
The Great Teaching Profile and Element-level feedback pages can be tricky to navigate. Is there an easier way we can access our personal feedback?
… And what we’ve done
We’ve been listening to feedback from existing and prospective teachers on the GTT, and we have made wholesale improvements to the feedback process, to go alongside the updated survey experience we blogged about previously. These changes make it easier for you and your colleagues to conduct feedback surveys, access your private feedback, and identify development and improvement priorities.
From the new “survey feedback” page on your dashboard, you can now select a timeframe (an academic year, or “all-time”), then tick as many of the completed surveys from that period of time as you want to be displayed.
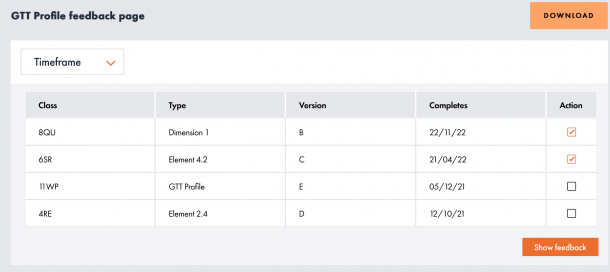
Whether these are whole GTT Profile surveys, individual Element feedback tools, or the new Dimension-level surveys, the relevant charts are loaded below.
We have also improved the interactivity between the charts – for example, clicking on an Element’s bar in the Profile chart takes you to the relevant Element section for more in-depth feedback. This makes it clearer and easier for you to get the information at the level you need, as quickly and easily as possible.
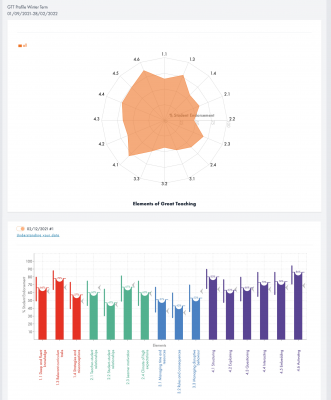
Finally, you can now more easily compare side-by-side the results from surveys with two different classes, for example, or a pre- and post-survey with the same class. The radar plot is overlaid with two different colours to enable comparison, and the bar charts will allow up to three surveys to be compared.
School or college coordinators and assistant coordinators also have access to a similar experience. In line with our commitment to teachers’ ownership of their GT Profile data, they will only be able to see aggregated data at a school level, once more than five teachers have completed a survey. More detailed coordinator oversight of other CPD activities, both in and out of the platform, can be found as part of the new CPD Passport feature.
How do I access this?
If your school or college already has a subscription, you can find the new-look feedback by clicking “Student surveys” in the menu, and then “Feedback”.
If not, you can find out more and sign up here, to benefit from this and all of the other CPD in the Great Teaching Toolkit.
Read more about other new features in the following posts:
- The GTT Community
- Our video observation tool, in partnership with VEO
- The CPD Passport
- Updates to the Development cycles section
- Improvements to the student feedback tools available in the platform
- Improved support to help guide implementation in your context


[…] to the feedback visualisations – look out for another blog to showcase these in the coming […]